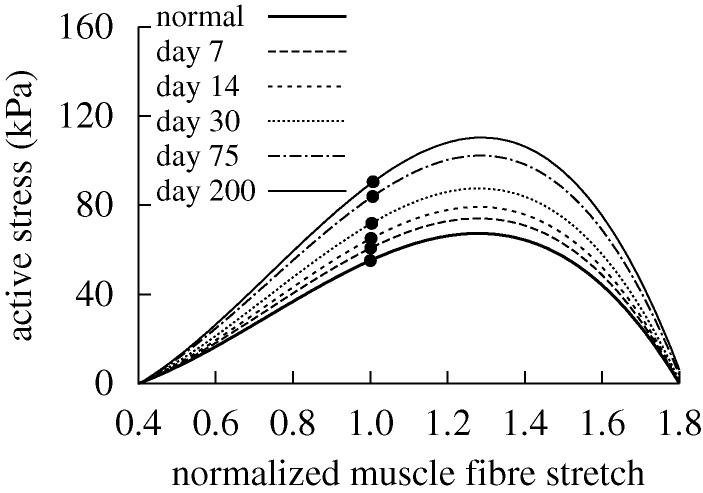
Figure 4.
Evolving active muscle response due to G&R for the case of  days, P=Ph and Q=Qh. The bold curve represents the active response before any perturbation. Solid points represent the state of activity for the vessel at the corresponding time. The abscissa ‘normalized muscle fibre stretch’ is expressed as a range of values for
  . Note the gradual increase in active stress from the time of perturbation (day 0) as the vessel becomes more muscular. While active muscle stress increased irreversibly, which would be energetically unfavourable, the vessel was able to maintain vasoactive function.

