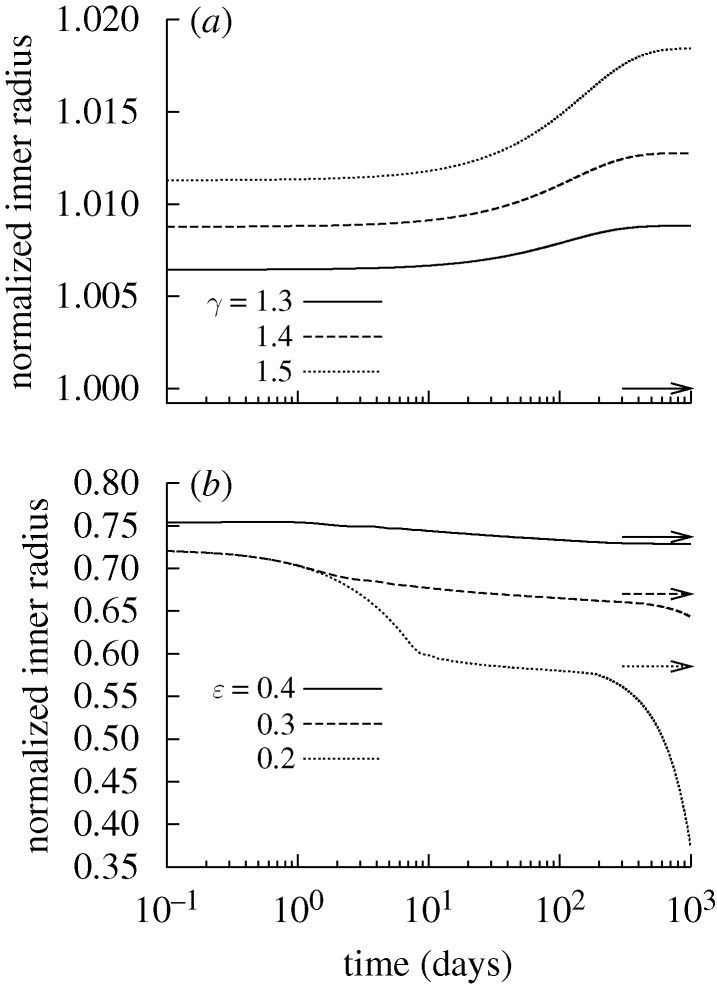
Figure 7.
Time courses of evolving inner radius for indicated changes in pressure P=γ Ph (a) and flow Q=ϵ Qh (b) where  and
and  days. Expected values (cf. equation (4.1)) are indicated by corresponding arrows on the right ordinate. Note that, for the cases of decreasing flow, the stable evolution range lies within the vessel’s instantaneous vasoactive range; note, too, the strongly diverging behaviour near day 200 for the case of ϵ=0.2, which suggests a sudden inability to regulate inner radius.

