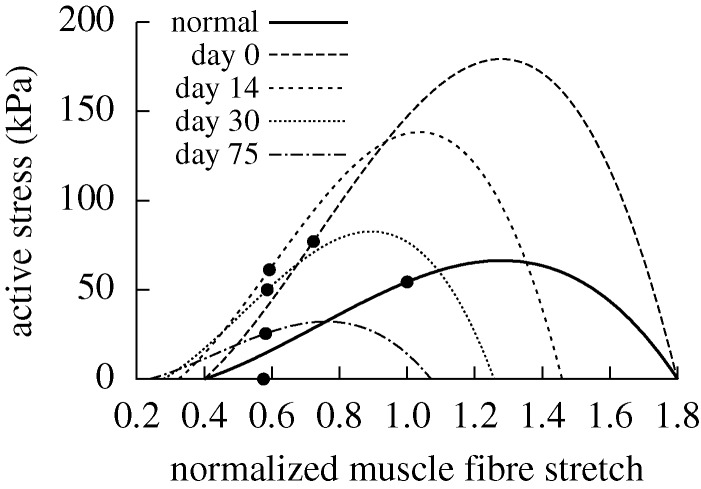
Figure 9.
Evolving active muscle response due to G&R for a change in flow where ϵ=0.2 and  and
and  days. The bold curve represents the active response before any perturbation. Solid points represent the state of activity for the vessel at the corresponding time. The abscissa ‘normalized muscle fibre stretch’ is expressed as a range of values for
  . Note the dramatic increase in active stress at the time of perturbation (day 0) and the gradual leftward shift as the active muscle remodels around a reduced inner radius. Also note the gradual reduction in vasoactivity after day 0 and eventual cessation by day 200, as denoted by the solid point on the abscissa. This loss of vasoactivity, coupled with constant collagen and smooth muscle deposition rates, resulted in the unbounded reduction of lumen caliber beginning near day 200 (figure 7b).

