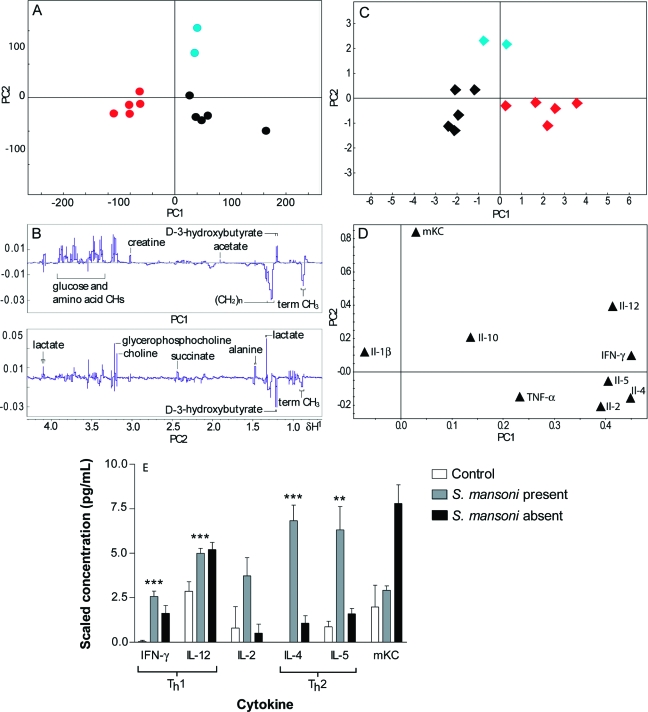
Figure 4.
(A) PLS-DA scores plot showing plasma metabolite-based differentiation of S. mansoni-infected (red), noninfected control animals (black) and mice, which did not establish infection (possibly demonstrating early expulsion) as assessed upon dissection (blue), and (B) loadings line plot for the first and second PCs. (C) PCA scores plot of the relative plasma cytokine concentrations, and (D) main corresponding loadings showing similar infection-related clustering as the spectral data; (E) bar chart showing plasma cytokine concentrations for S. mansoni-infected mice. Values are mean ± standard deviation. Significance determined by Student’s t-test (2-tailed, unpaired) p = * <0.05, ** <0.01, *** <0.001 (since there were only two animals in which infection failed to establish, statistical significance was not determined for the intermediate group). Note: Cytokine concentrations have been scaled to allow visual comparison across cytokines. IL-4 scaled 1:2, IL-5 scaled 1:10, IL-12 scaled 1:50 and mKC scaled 1:200. *No significance given for mKC for S. mansoni-absence since n = 2.

