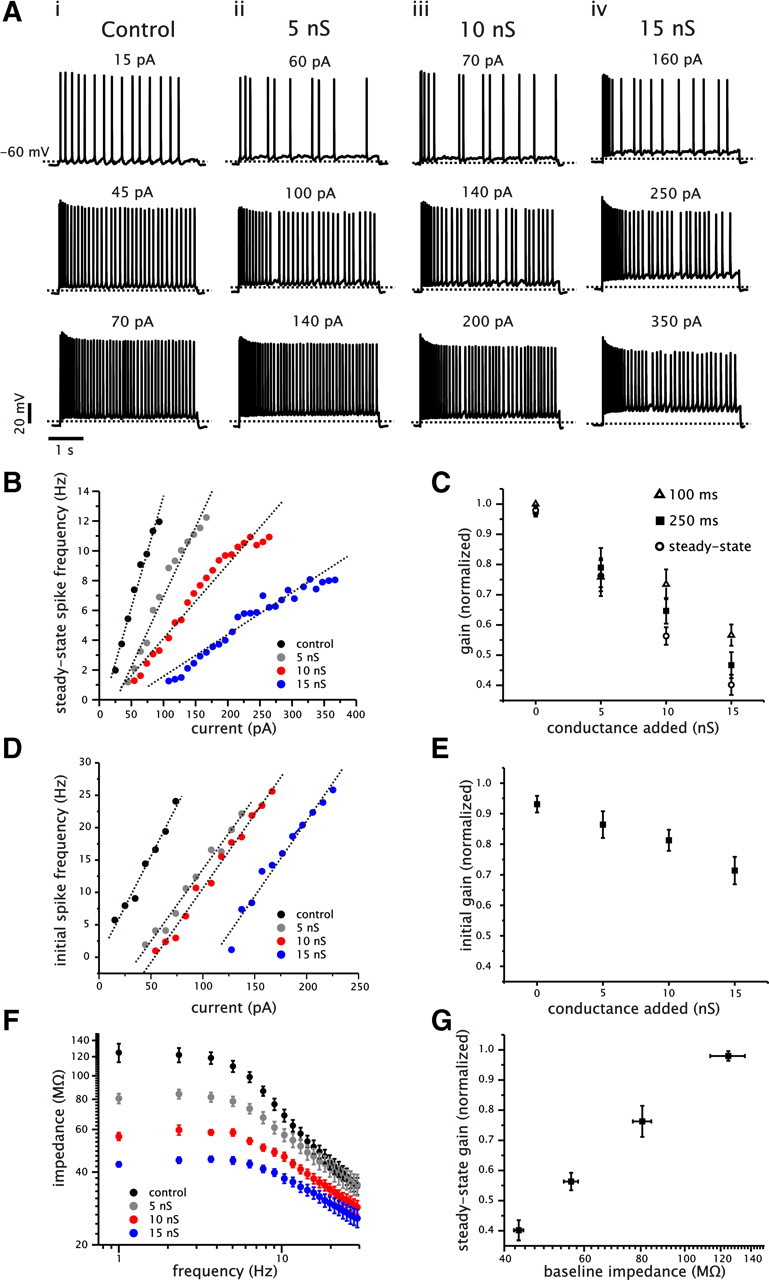
Figure 1.

Increased somatic conductance reduces the gain of the steady-state f–I relationship of CA1 pyramidal cells. A, Examples of voltage traces from a single CA1 pyramidal cell with different levels of added conductance (i–vi: control, 5, 10, and 15 nS) in response to 4 s current steps. For each level of conductance, three levels of firing range are shown, which correspond approximately to the low, medium, and high spike frequency range of the f–I plot for each level of conductance. B, Plot of the steady-state f–I relationship for a single cell (same cell as shown in A) under different levels of added conductance. Data points for each conductance level were fit using a linear regression (dashed lines) to calculate the gain of the f–I relationship. C, Plot of average normalized gain as a function of added conductance for spike frequencies calculated at steady state (open circles), 100 ms (open triangles), and 250 ms (filled squares). For each level of added conductance, the gain was calculated as in B and then normalized to the control value. D, Plot of the initial (first spike) f–I relationship for a single cell (same cell as shown in A) under different levels of added conductance. E, Plot of average normalized initial gain calculated for each level of added conductance. As before, the gain was normalized to the control value. F, Plot of input impedance for CA1 pyramidal cells under control conditions and in the presence of 5, 10, and 15 nS of added conductance. G, Plot of normalized steady-state gain as a function of baseline input impedance.
