Figure 4.

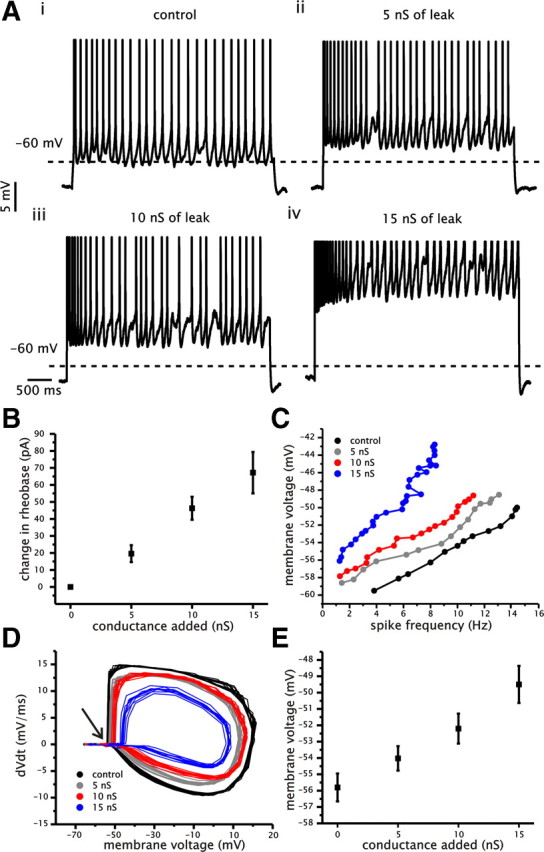
Increased membrane conductance increases spike voltage threshold and mean voltage during spike generation. A, Examples of voltage traces from a single CA1 pyramidal cell with different levels of added conductance (i–vi: control, 5, 10, and 15 nS) in response to a 4 s current step. Current steps were modified to maintain an approximate steady-state firing rate of 5 Hz. Dashed lines indicate the −60 mV level. B, Plot of average change in rheobase relative to control for each level of added conductance. C, Example plot of mean membrane voltage as a function of spike firing frequency under control and for 5, 10, and 15 nS of added conductance. D, Plot of the voltage derivative (dV/dt) as a function of membrane voltage under control and for 5, 10, and 15 nS of added conductance during steady-state spike firing at an approximate frequency of 5 Hz. Arrow indicates region of rapid increase in the membrane voltage trace associated with spike generation. E, Plot of average membrane voltage during spike firing (averaged for each cell across entire f–I range) as a function of the level of added conductance.
