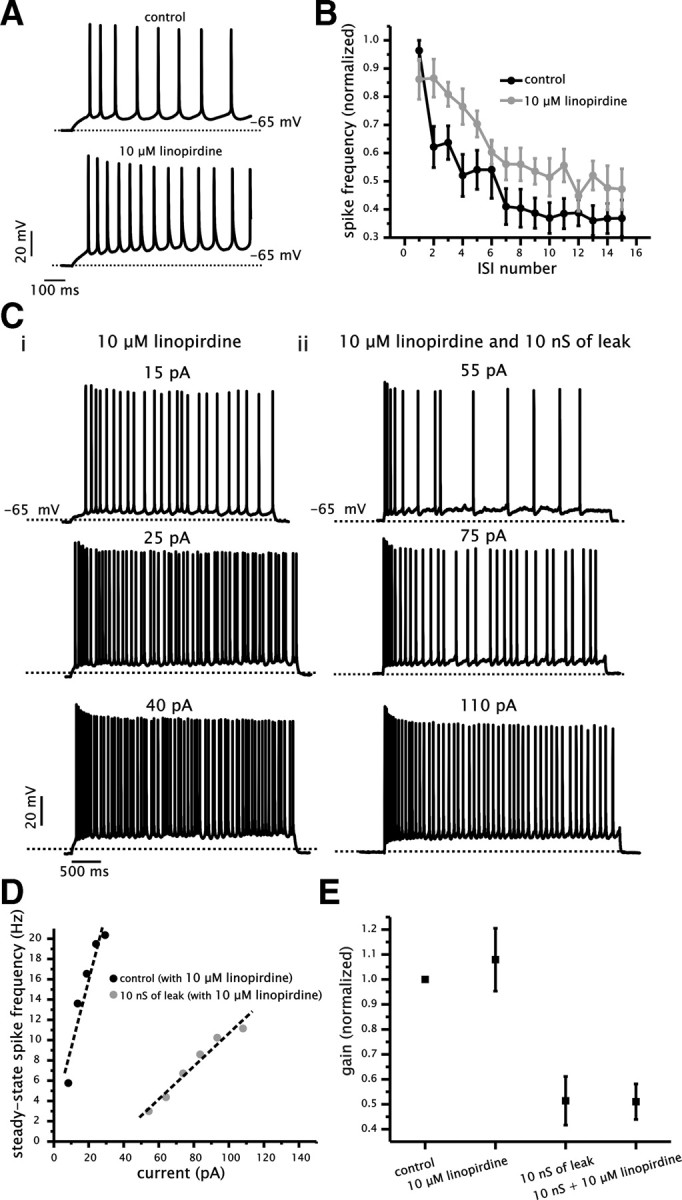
Figure 6.

Block of IM with linopirdine does not affect the ability of added conductance to reduce the gain of the f–I relationship. A, Example of voltage traces generated in response to square current steps under control (top) and with 10 μm bath-applied linopirdine (bottom). B, Plot of normalized spike frequency as a function of ISI number for control (black circles) and with linopirdine (gray circles). C, Example of voltage traces generated in response to 4 s square current steps in the presence of linopirdine with or without added conductance (10 nS). D, Plot of the steady-state f–I relationship for a single cell in the presence of linopirdine with (black circles) and without (gray circles) added conductance (10 nS). E, Plot of normalized gain for control and 10 μm bath-applied linopirdine with or without 10 nS of added conductance. For each cell, gain measurements were normalized to the control value.
