
Figure 7.
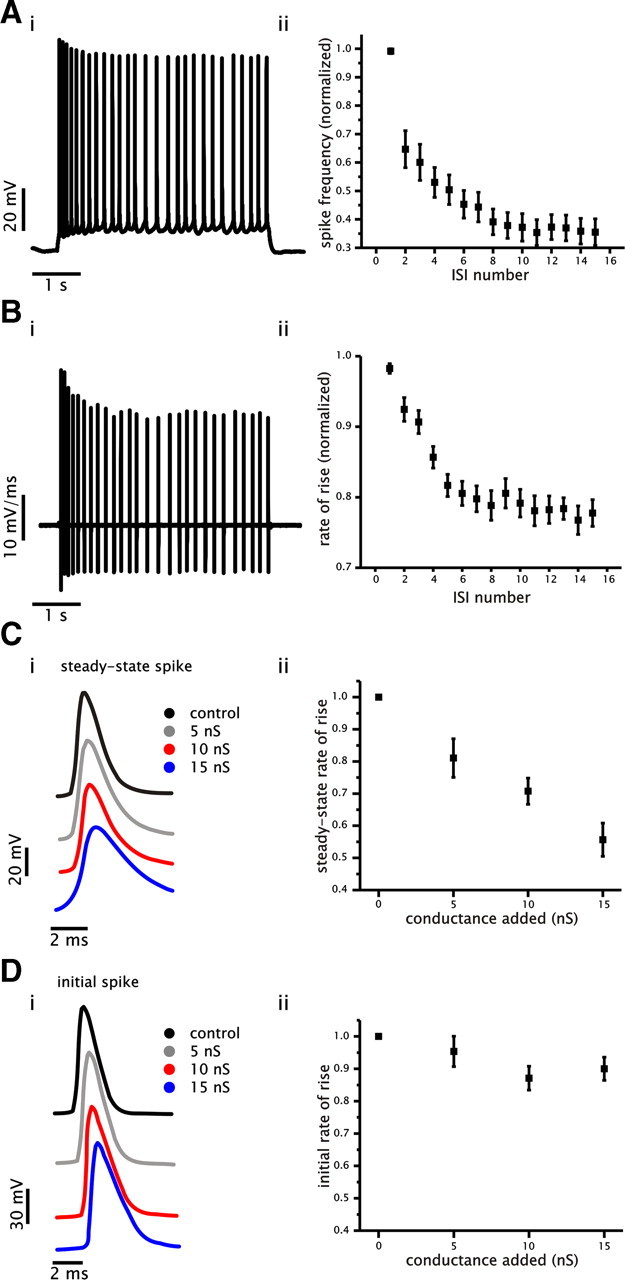
Spike frequency adaptation and changes in gain by added conductance correlate with decreased Na+ conductance availability. A, Example of a voltage trace showing spike frequency adaptation that was generated in response to a 4 s current step under control conditions (i). Plot of average normalized spike frequency as a function of ISI number (ii). B, Example of a membrane voltage derivative trace generated in response to a 4 s current step (same cell as shown in Ai). Plot of average normalized spike rate of rise for spikes generated at steady state as a function of ISI number under control conditions (ii). C, Examples of spike voltage trajectories generated at an approximate steady-state firing frequency of 5 Hz under control and with 5, 10, and 15 nS of added conductance (i). Plot of average normalized rate of rise for steady-state spikes as a function of added conductance (ii). D, Examples of spike voltage trajectories taken from the initial spike under control and with 5, 10, and 15 nS of added conductance (i). Plot of average normalized rate of rise for initial spikes as a function of added conductance (ii).