
Figure 8.
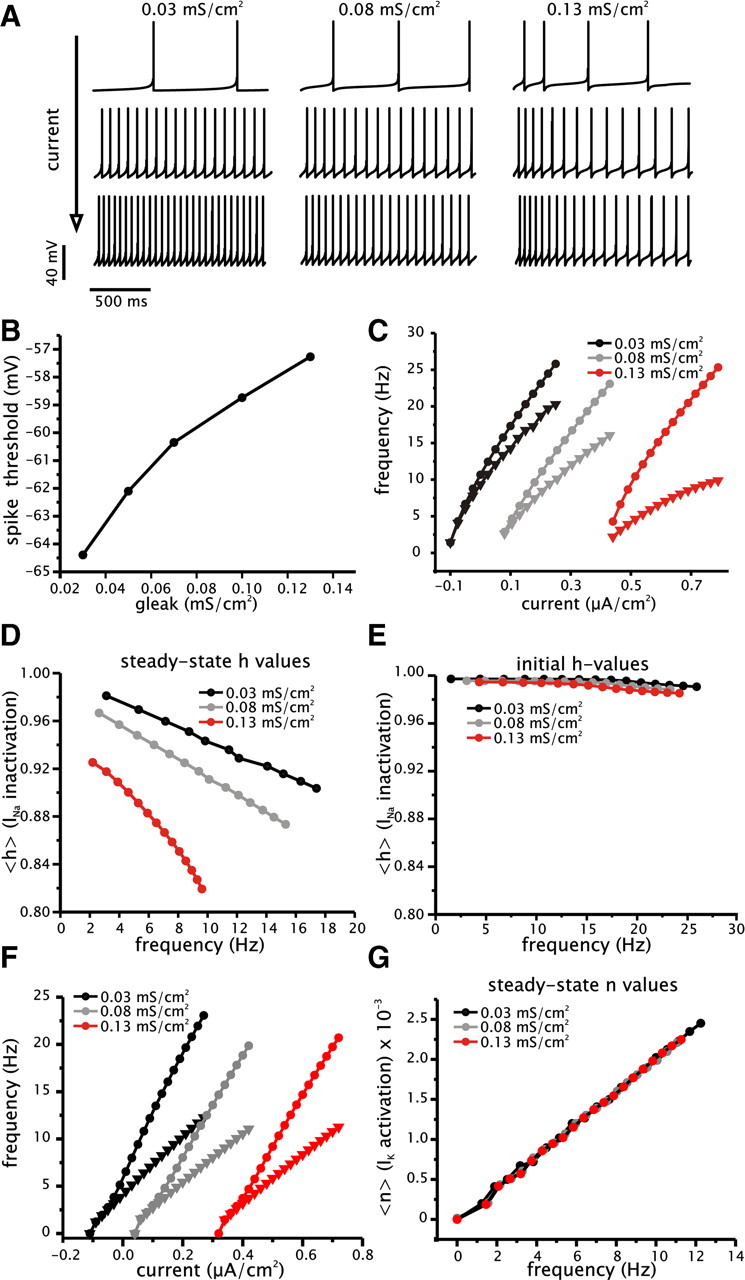
Effects of increased conductance on spike frequency adaptation and steady-state gain can be reproduced in a simple conductance-based model. A, Examples of membrane voltage traces from model under three different levels of leak conductance (0.03, 0.08, and 0.13 mS/cm2) generated with increasing levels of driving current. B, Plot of spike voltage threshold as a function of leak conductance (gleak). Spike threshold was determined using a bifurcation analysis and defined as the membrane voltage value corresponding to the elimination of the stable fixed point (resting membrane voltage) and formation of a stable limit cycle (spike firing solution). C, Initial (circles) and steady-state (triangles) f–I relationships for model under three different levels of leak conductance (0.03, 0.08, and 0.13 mS/cm2). Note that the steady-state f–I relationships shows a greater degree of saturation than the initial f–I relationships. D, E, Plots of the mean availability of Na+ conductance (h) as a function of steady-state (D) and initial (E) firing frequency. Plots were generated for three different levels of leak conductance (0.03, 0.08, and 0.13 mS/cm2). F, Initial (circles) and steady-state (triangles) f–I relationships for model incorporating spike-dependent adaptation under three different levels of leak conductance (0.03, 0.08, and 0.13 mS/cm2). Note that the steady-state f–I relationships, unlike the previous model, do not show saturation and are a linear function of driving current. G, Plots of the mean availability of the spike-dependent K+ conductance (n) as a function of steady-state firing frequency. Plots were generated for three different levels of leak conductance (0.03, 0.08, and 0.13 mS/cm2).