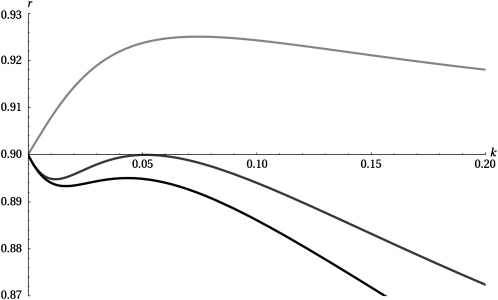
Figure 1.—
Sequence of three plots of the maximal eigenvalue of the projection matrix, r, as a function of k. The parameters used are T = 20, Δ = 0.2, γ = 1. The top line (light gray) shows the symmetric case, δ = 0, whereas the middle line (dark gray) and the bottom line (black) show the cases δ = 0.5 and δ = 1.0, respectively. The plot demonstrates the discontinuous nature of the transition from switching to nonswitching as δ is increased. Note also how the optimal switching rate approaches 1/T from above as δ increases, even if switching is not globally evolutionarily optimal.

