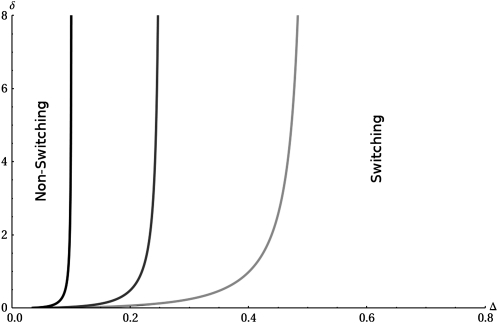
Figure 2.—
Phase plane in (Δ,δ) space showing the transition lines between the switching regime and the nonswitching regime. The plot shows exact numerical calculations of the phase boundaries. The symbolic mathematical package Mathematica was used to determine the maximum value of the eigenvalues in Equation 6 across the full range of k and then to compare these with the eigenvalue corresponding to k = 0. The light gray line represents T = 10, dark gray represents T = 20, and black represents T = 50. The asymptote as δ increases can be approximately determined as Δ* ≈ 5.1/T; see text for details.

