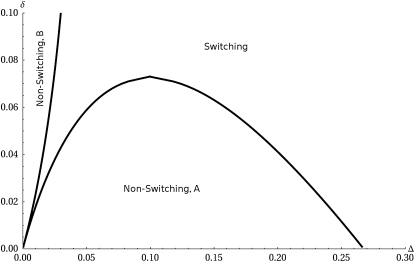
Figure 3.—
Blown-up region close to the origin showing the varied possibilities in the case where both the environmental periods and the fitness differences are asymmetric. This is the case TA = 60, TB = 20. The fitness of the A phenotype in environment B is less than that of the B phenotype in environment A by an amount δ. The line  determines which phenotype is favored when no switching occurs.

