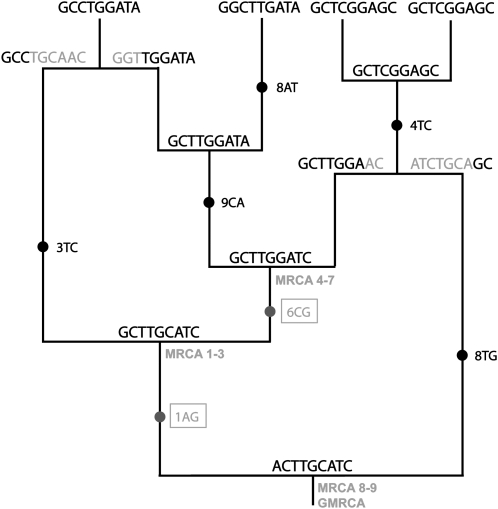
Figure 2.—
Example of the evolution of nucleotides on the ancestral recombination graph in Figure 1. Substitutions along branches are marked with solid circles, followed by the position and the states involved. The two changes that occur between the GMRCA and the MRCAs (enclosed in a box and shaded) are fixed in the sampled sequences, so the corresponding ancestral states in the GMRCA (1A and 6C) cannot be recovered from this sample.

