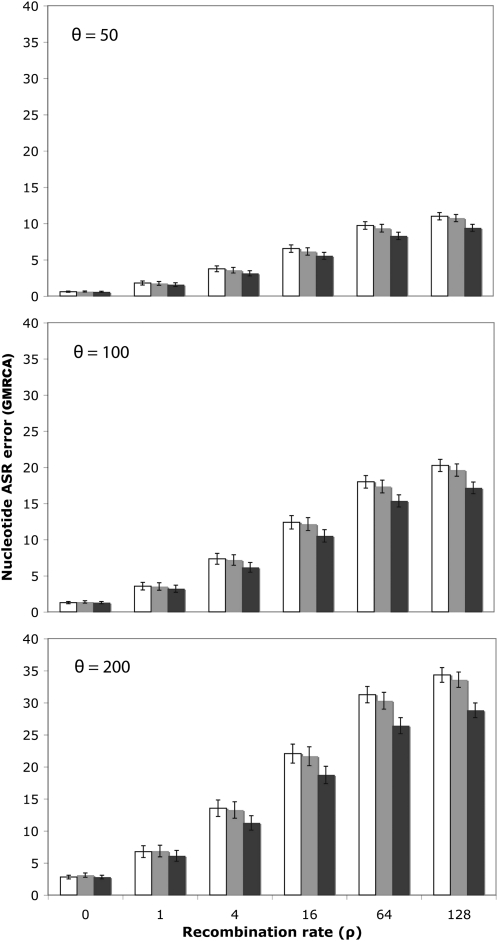
Figure 3.—
Nucleotide ASR error as a function of the recombination rate. The percentage of nucleotide differences is shown between the inferred and the simulated GMRCA sequences, ignoring recombination (open), using the fragments and trees inferred by GARD (shaded), or using the simulated (true) fragments and trees (solid) for different levels of diversity (θ) and recombination (ρ). Error bars indicate 95% confidence intervals. In the example shown, ancestral nucleotide sequences were inferred using joint ML in HYPHY.

