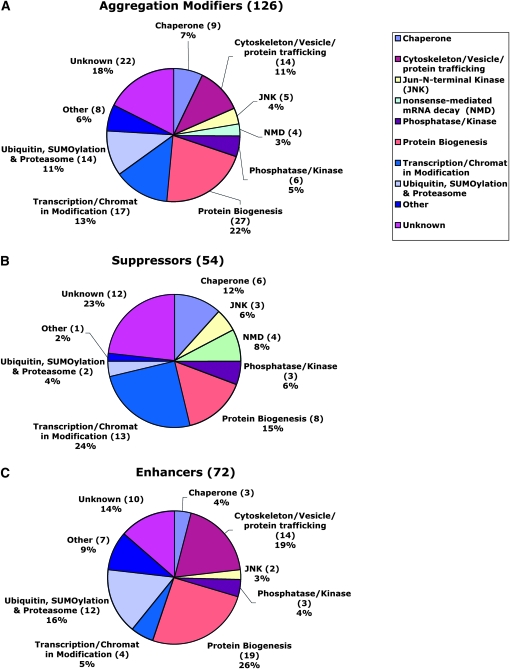
Figure 4.—
Functional categorization of aggregation regulators from the screen. Pie chart representation of candidate genes based upon their Gene Ontology index biological function or protein domains shows the categories of all 126 hits (A) and the 54 suppressors (B) and 72 enhancers (C) that can modulate the formation of mutant Htt aggregates from the screen. “Enhancer” is defined genetically as the gene that causes reduced aggregates formation after RNAi-mediated knockdown of target gene expression in the assay. Conversely, “suppressor” is defined as the gene that causes increased aggregates formation when its expression is knocked down.

