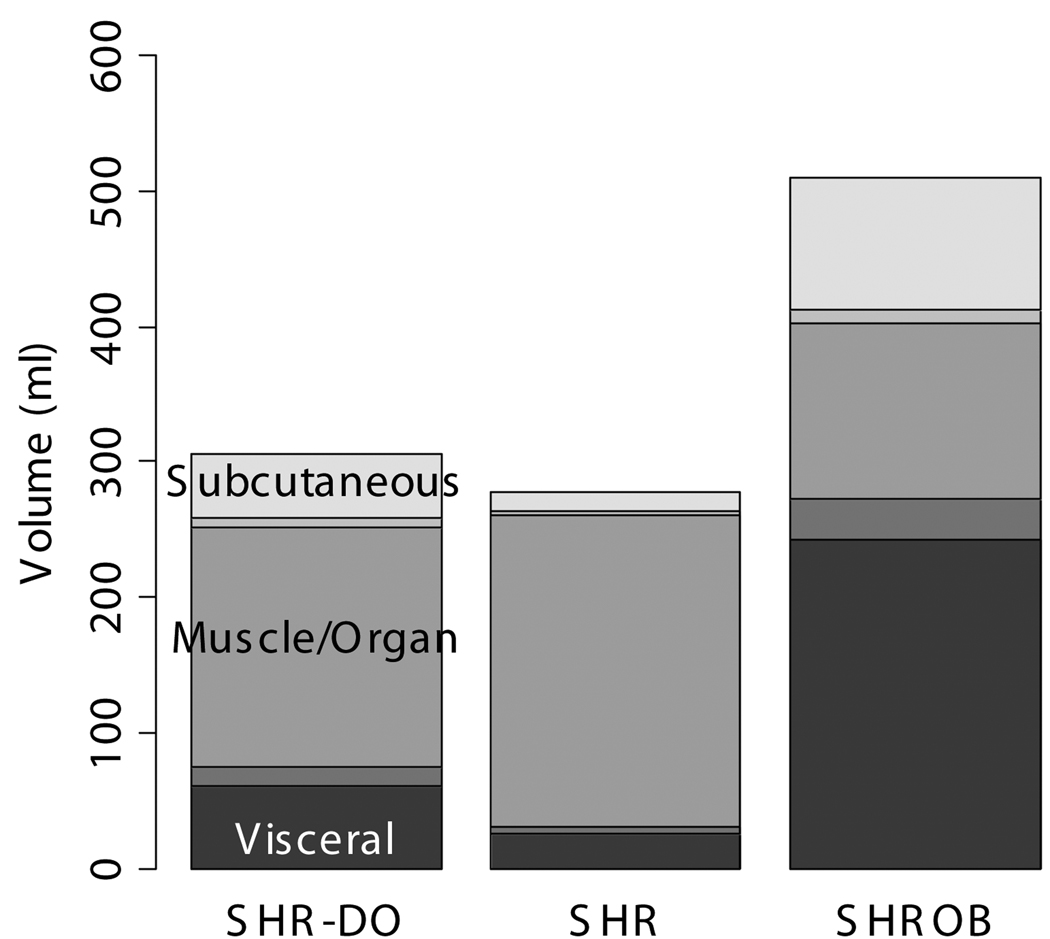
Fig. 9.
Partial volume corrections differ between types of rats due to the differing adipose distribution. If only the edge pixels are corrected then the overall change in volumes is <1%. However, we found that correcting all the voxels in the rat was significant. The bar plots show each of the depots in ml vs. diet and genetics. The partial volume corrections are shown as gray bars in between the muscle/organ depot and the adipose tissue depots. Generally the amount of correction is proportional to the animal size. The muscle/subcutaneous partial volume effect is smaller in absolute volume, but it is quite large relative to the size of the subcutaneous depot. Partial volume correction enhances the statistical conclusions as described in the text. In every case it was found that the muscle and other organs were over-estimated before partial volume correction.

