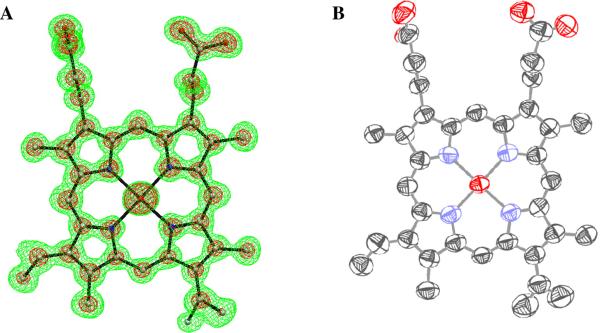
Figure 1.
(A) 2Fo-Fc map density for the refined heme group, calculated using the 0.93 Å native Mn-MnP data set. The contours are drawn at 1.0 σ (green) and 4.0 σ (magenta). (B) Thermal ellipsoid diagram for the heme group drawn using ORTEP. The structure, including anisotropic B-factors, was refined using the SHELXL program [44].

