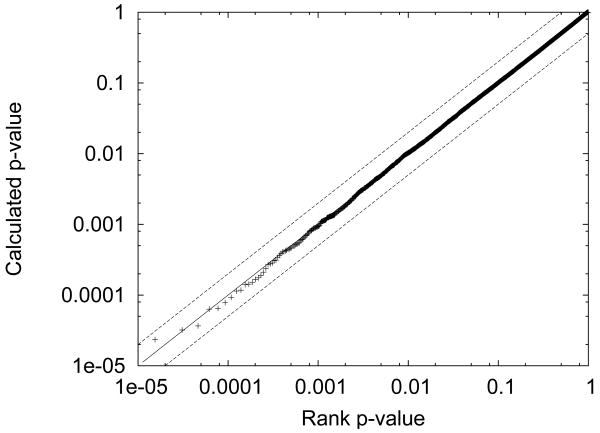
Figure 5. Decoy p-values follow a uniform distribution.
The figure plots the calculated p-value as a function of the rank p-value for all candidates and all spectra in the data set. The rank p-value of a score x is defined as the fraction of scores that are greater than or equal to x. The distribution of p-values is compared against y = x (solid line), y = 2x and y = x/2 (dotted lines).

