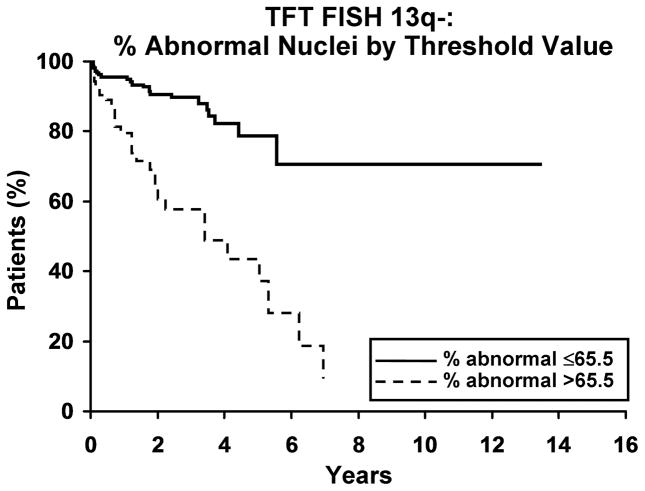
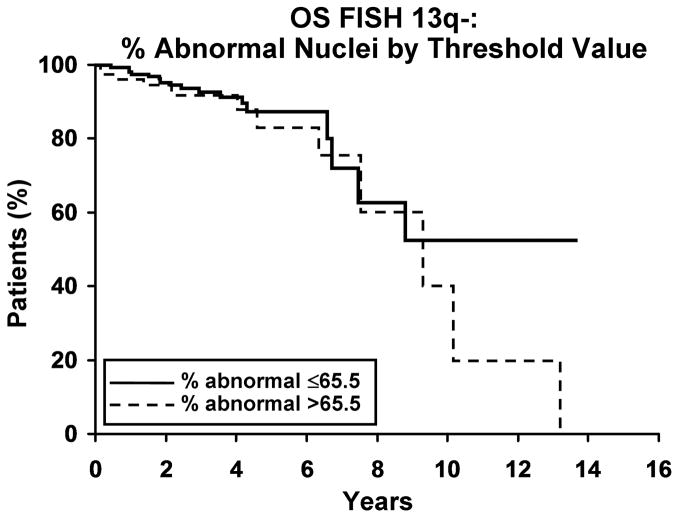
Figure 2. Clinical outcome for patients with 13q- by threshold value.
2a. Time to first treatment (TFT) and percentage of abnormal nuclei by threshold. A higher percentage of abnormal nuclei, with either 13q-x1 or 13q-x2, is associated with a significantly shorter TFT (p<0.001, HR=4.4 (2.5–7.7)). Median time to treatment for % abnormal ≤ 65.5% and >65.5% was not reached and 3.4 years, respectively. The 5-year untreated rate for % abnormal ≤65.5% and >65.5% was 79% and 38%, respectively. 2b. Overall survival (OS) and percentage of abnormal nuclei by threshold. OS appears not to be affected by the percentage of abnormal nuclei (p=0.28, HR=1.5 (0.7–3.2)). Median OS for % abnormal ≤65.5 and % abnormal >65.5 are not reached and 9.3 years, respectively. The 5-year survival rate for % abnormal ≤65.5% and >65.5% was 88% and 83%, respectively.


