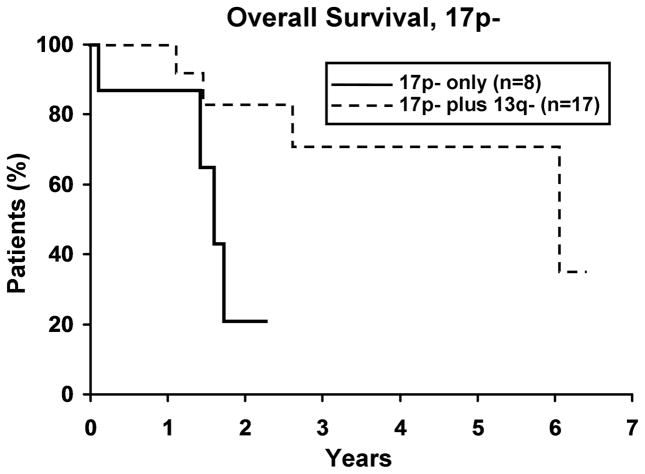
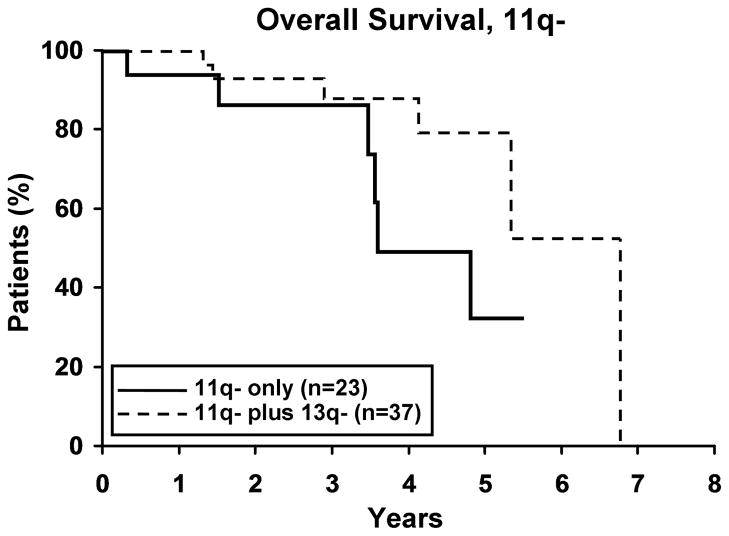
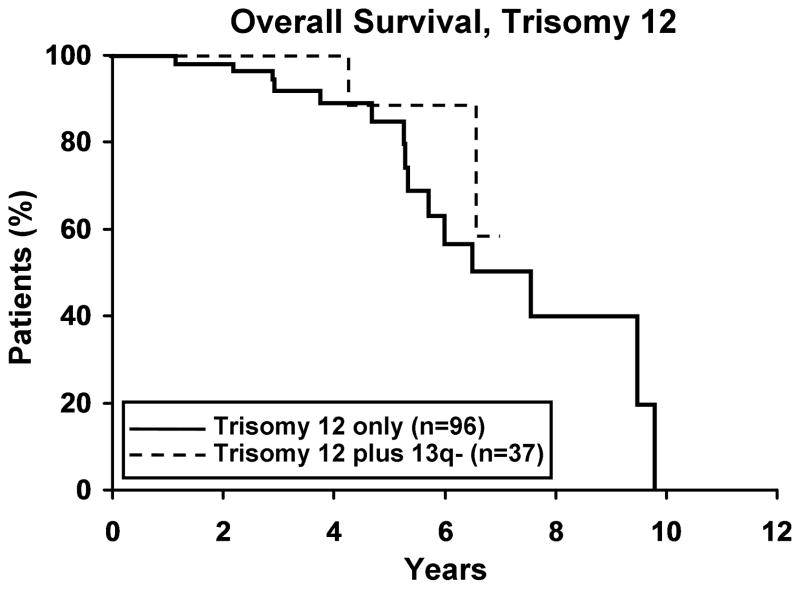
Figure 4. Overall Survival (OS) for 13q- with a second FISH abnormality.
4a. Isolated 17p- (n=8) vs 17p- plus 13q- (n=17). There was a significant difference in OS between the two 17p- groups with the 17p-plus 13q- patients surviving longer (p=0.019). Median OS for 17p- and 17p- plus 13q- was 1.6 and 6.1 years, respectively. 4b. Isolated 11q- (n=23) vs 11q- plus 13q- (n=37). Though not significant, there appears to be a trend in OS between the two 11q- groups with the 11q- plus 13q- surviving longer (p=0.07). Median OS for 11q- and 11q- plus 13q- was 3.6 and 6.7 years, respectively. 4c. Isolated trisomy 12 (n=96) vs trisomy 12 plus 13q- (n=37). There was no difference in OS between the two trisomy 12 groups (p=0.39). Median OS for trisomy 12 and trisomy 12 plus 13q- was 7.5 years and not reached, respectively.


