FIGURE 6.

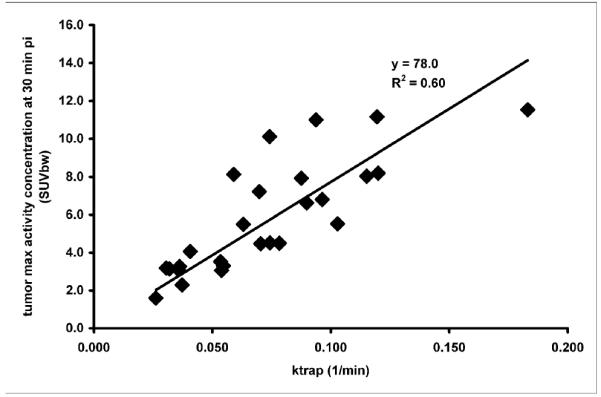
Scattergram showing relationship between the ktrap parameter values calculated in Model 1 with the 30 minute SUV value. These data are fitted with a line forced through the origin.

Scattergram showing relationship between the ktrap parameter values calculated in Model 1 with the 30 minute SUV value. These data are fitted with a line forced through the origin.