
Figure 2.
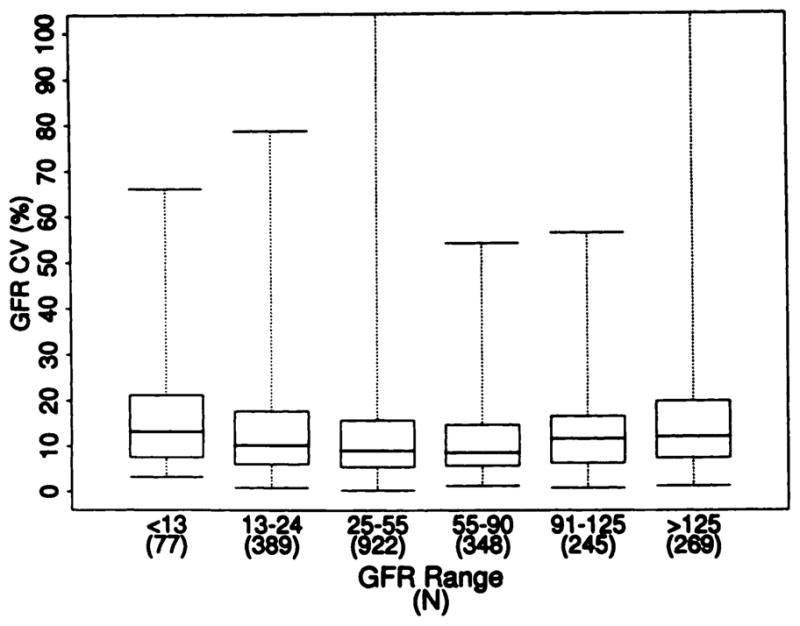
Relationship of intratest CV for GFR to level of GFR. Box plots show the minimum value (bottom line). maximum value (top line), middle 50% of values (box), and median value (middle line). Kruskall-Wallis test, P < 0.0001. (Four values for intratest CV >100% are not shown.)