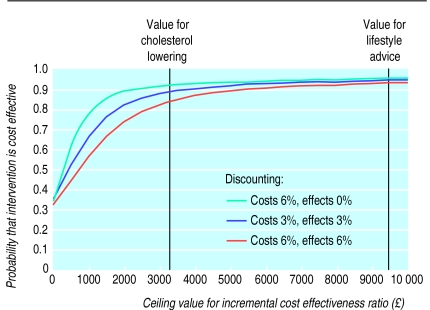
Figure 4.
Cost effectiveness acceptability curves: probability that cost per life year gained from within trial effect of treatment is cost effective (y axis) as a function of decision maker’s ceiling cost effectiveness ratio (x axis). Also shown is cost effectiveness of cholesterol lowering in 59 year old men with history of heart disease14 and advice on lifestyle to 50 year old men to reduce cardiovascular risk15

