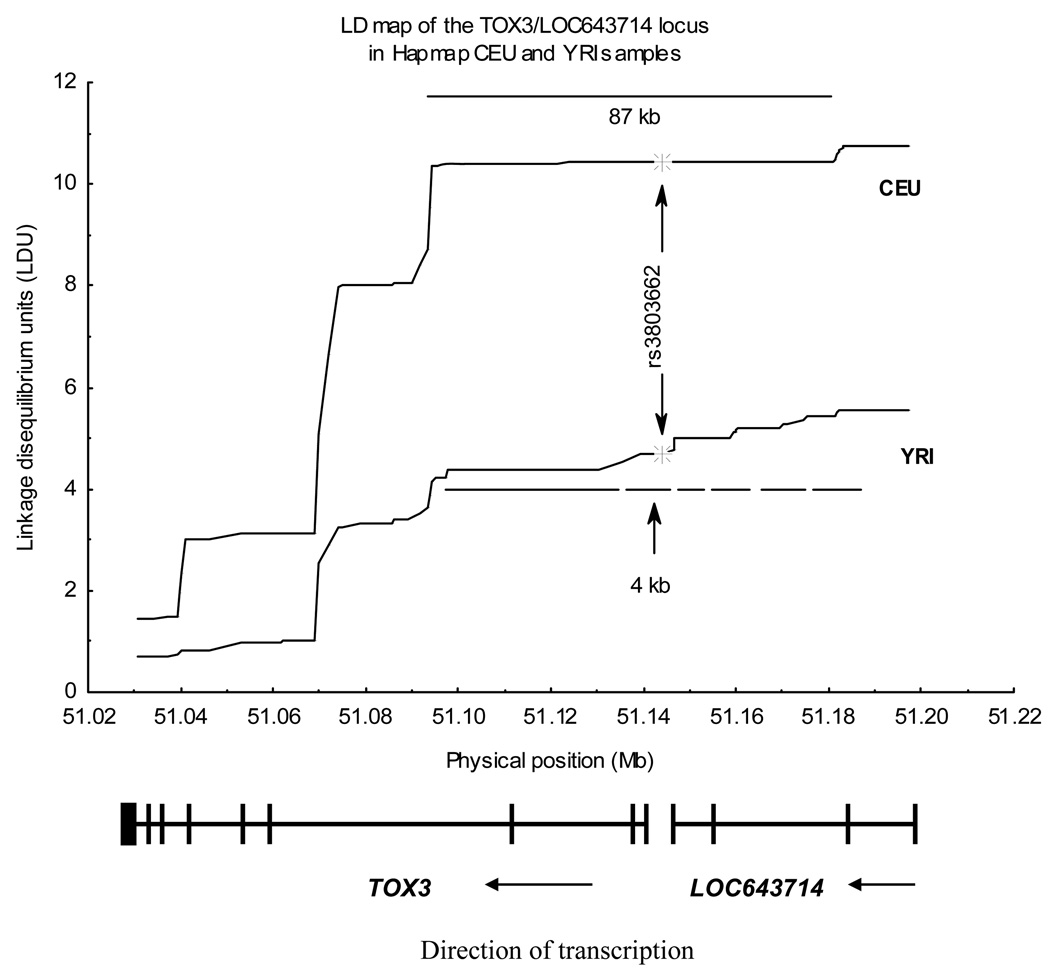
Figure 1. Linkage disequilibrium (LD) structure of the TOX3/LOC643714 region in HapMap CEU and YRI populations.
LD structure was assessed using linkage disequilibrium units (LDU) estimated with the SNPBrowser software (25). LDU are proportional to the decay of LD along the physical distance. Regions of constant (‘flat’) LDU represent LD blocks. Note that the big block (from 51.09 Mb to 51.18 Mb) that covers parts of the TOX3 and LOC643714 genes in HapMap CEU population and it is split into smaller blocks and gaps in the HapMapYRI population.

