
Figure 4.
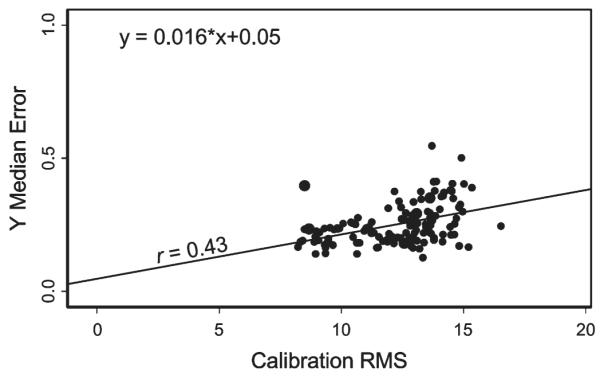
A scatterplot showing the relationship between calibration root-mean-square (RMS) values (digits) on the x-axis and the Y median error (mm) on the y-axis.
Official websites use .gov
A
.gov website belongs to an official
government organization in the United States.
Secure .gov websites use HTTPS
A lock (
) or https:// means you've safely
connected to the .gov website. Share sensitive
information only on official, secure websites.
A scatterplot showing the relationship between calibration root-mean-square (RMS) values (digits) on the x-axis and the Y median error (mm) on the y-axis.