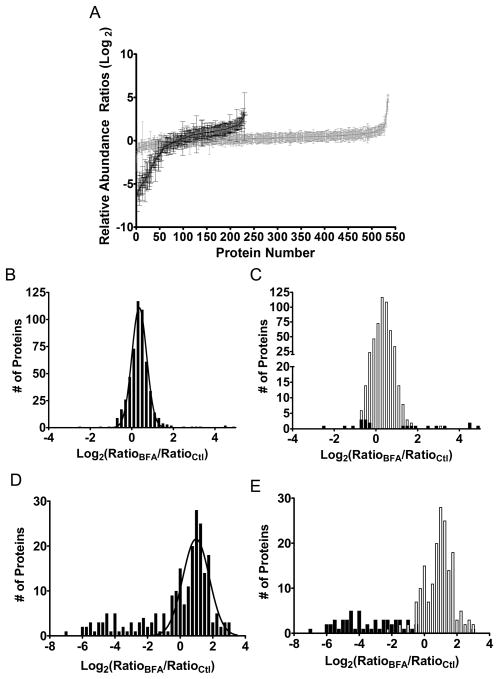
Figure 3.
Brefeldin A-induced changes in relative protein abundance. Relative protein abundance ratios were calculated by normalizing protein ratios calculated in the BFA-treated astrocyte sample to the corresponding protein ratio from the control sample. Gaussian curve fit parameters; mean ratio (r0), standard deviation of the mean ratio (SD), and the background distribution (σ) were calculated for protein ratio distributions. (A) Individual log2 protein ratios from ACM (black; N = 231) and cell lysates (gray; N=535) plotted in order of increasing relative abundance. (B) Histogram of BFA-induced changes in cell lysates as a function of log2 normalized protein ratio. Protein ratio distribution demonstrated good fit to the Gaussian curve (r0 ± SD = 1.28 ± 0.01, σ = 1.28). (C) Significantly altered cell lysate protein ratios (black) versus non-significant protein ratios (white) calculated using the complementary error function (p < 0.05) and Gaussian curve fit values. Scaling of the y-axis has been modified to emphasis the significantly altered (black) data points. (D) Histogram of BFA-induced changes in relative protein abundance of ACM proteins. Curve fit values for ACM protein ratios were r0 ± SD = 1.97 ± 0.10, σ = 1.75. (E) Significantly altered cell lysate protein ratios (black) versus non-significant ratios (white) calculated using the complementary error function (p < 0.05) and Gaussian curve fit values.

