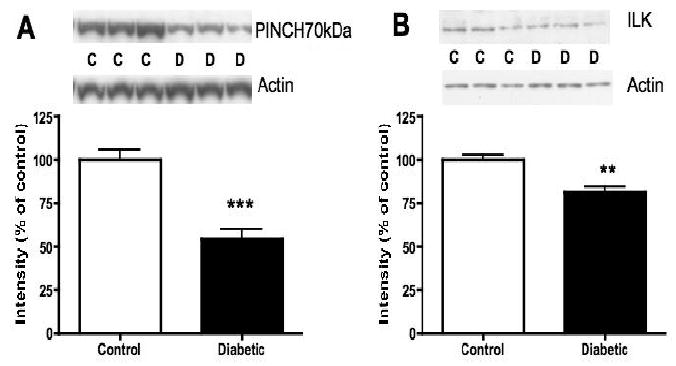
Fig. 1.

Protein levels of PINCH and ILK in lumbar spinal cord of non-diabetic control (C) and 20-week diabetic (D) rats. A: Intensity of bands corresponding to PINCH 70kDa normalized to the intensity of bands corresponding to actin. B: Intensity of bands corresponding to ILK normalized to the intensity of bands corresponding to actin. Data are represented as mean + SEM, n=6, **p<0.01, ***p<0.001 using unpaired, two-tailed t-test.
