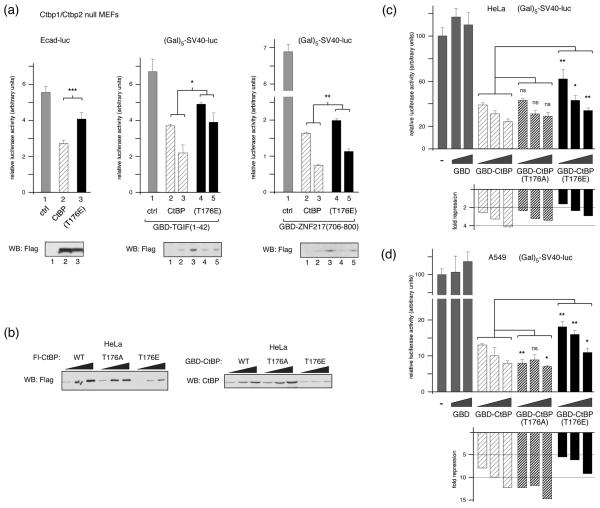
Fig. 7. Decreased expression and transcriptional repression by CtBP(T176E).
(a) Ctbp1/2 double null MEFs were transfected with an E-cadherin promoter-based Luciferase reporter and expression vectors encoding Flag-CtBP1 or CtBP(T176E) [left], or with a (Gal)5-SV40-Luciferase reporter, an expression vector encoding a Gal4 DNA binding domain (GBD) fusion to amino acids 1-42 of TGIF [center], or the (Gal)5-SV40-Luciferase reporter and a GBD fusion to amino-acids 706-800 of ZNF217 [right], with increasing amounts of Flag-CtBP1 or CtBP(T176E). Luciferase activity is presented as mean + s.d. of triplicate transfections. CtBP1 expression was assayed by western blot with a Flag antibody (below). (b) Relative expression in HeLa cells of increasing amounts of transfected Flag- or GBD-tagged CtBP1, or the T176A and T176E mutants, was analyzed by western blot (triangles represent increasing amounts of transfected CtBP1 expression construct; 100, 200 and 400ng per 35mm dish). HeLa cells (c), or A549 lung epithelial cells (d) were transfected with the (Gal)5-SV40-Luciferase reporter and an expression vector encoding the GBD, or a GBD fusion to wild type or T176A, or T176E CtBP1 as indicated. Luciferase activity is presented as mean + s.d. of triplicate transfections (upper panels) and as fold-repression relative to the control transfection (below). Triangles represent increasing amounts of transfected GBD expression construct; 3, 9 and 27ng per 35mm well (or 0, 9 and 27ng for the GBD). Significance testing was by student's T test. ***: p < 0.001, **: p < 0.01, *: p < 0.05, ns: not significant.

