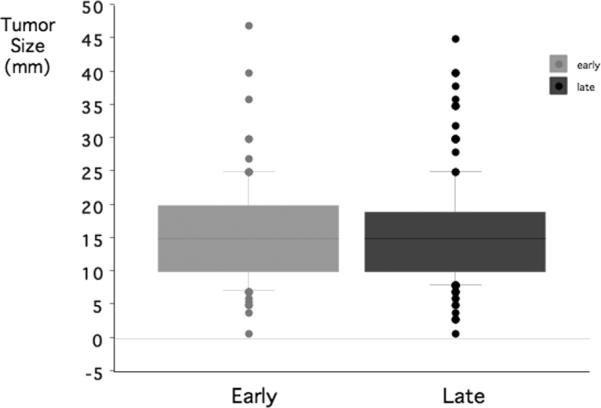
Figure 2.

The distribution of pituitary tumor sizes in the early vs. later group of the cohort Horizontal lines of the box plots indicate the 10th, 25th, 50th, 75th and 90th percentiles of the distributions and tumers < 10th or > 90th percentiles are individual data points.
