Figure 5.
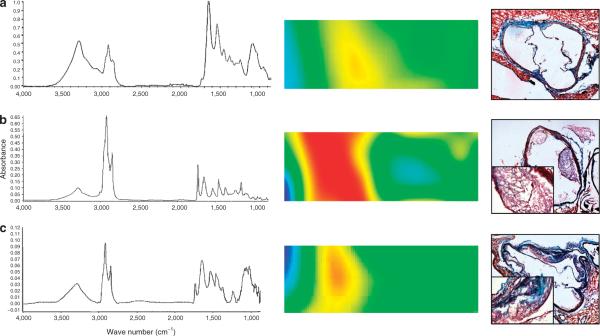
Infrared microspectrometry of lesions in the mice. Left, average infrared spectrum of lesions from each group. Middle, infrared spectral image, with the intima oriented to the left, and the lumen in blue. The spectral image shows the relative lipid concentration in shades of red based on the peak doublet between 2,800 and 3,000 cm−1 (image size = 30 × 90 μm). Right, Gomori trichrome staining in aortic root sections illustrates increases in collagen deposition (teal blue color) in TAG compared to SUCR-fed mice. Inset is a higher magnification (×40) of the lesion area. (a) CONTROL mice showed the lowest concentration of vascular wall lipid (peak doublet between 2,800 and 3,000 cm−1). (b) Atherosclerotic lesions of SUCR-fed mice had by far the largest concentration of lipids, while lesions in the (c) TAG-fed mice showed an intermediate lipid content. The broad peak at 1,100 cm−1, associated with collagen, is missing in the spectrum of lesions from SUCR-fed mice.

