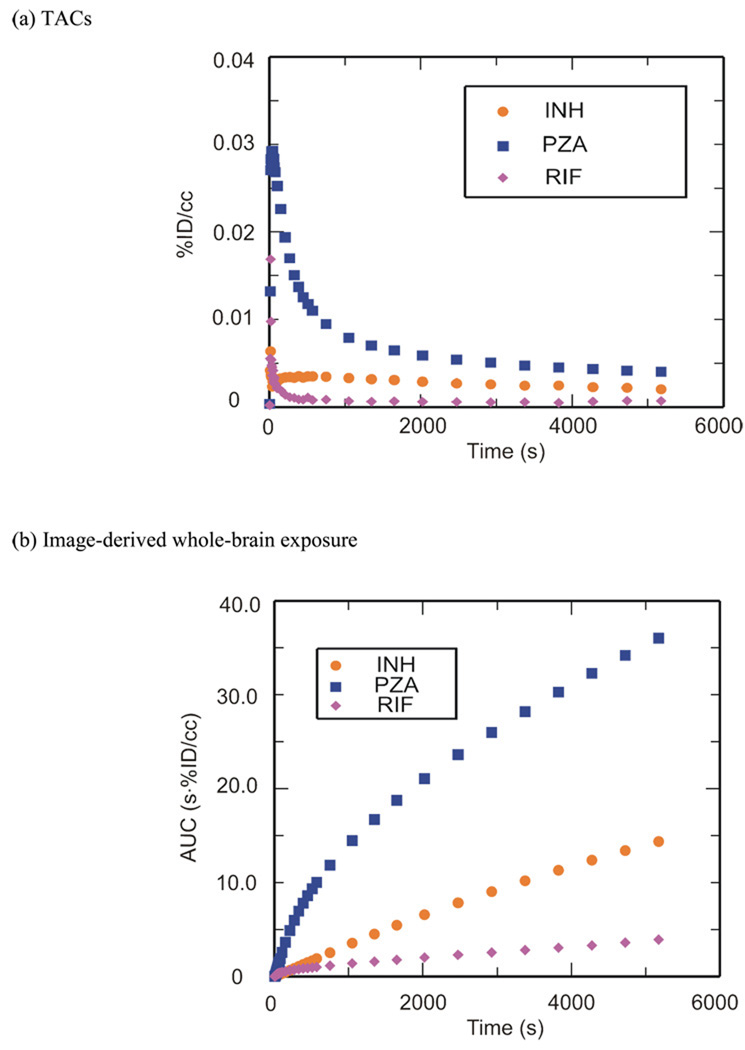
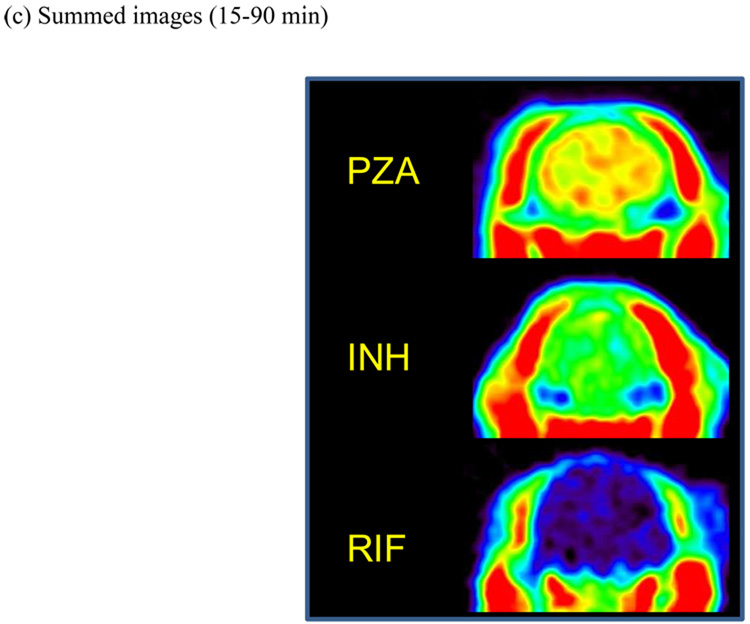
Figure 1. Blood-brain barrier penetration, brain tissue bioavailability and TACs for [11C]PZA, [11C]INH and [11C]RIF.
(a) TACs generated from the image acquired after i.v. administration of each drug in baboons by manually drawing the ROIs. (b) Whole-brain regions of interest were used to generate TACs for each labeled drug. The resulting curves were integrated as a function of time to produce AUC plots. (c) Dose corrected coronal images summed over frames 24–35 (15–90 min). The NIH color scale was used to represent relative radioactivity concentration.


