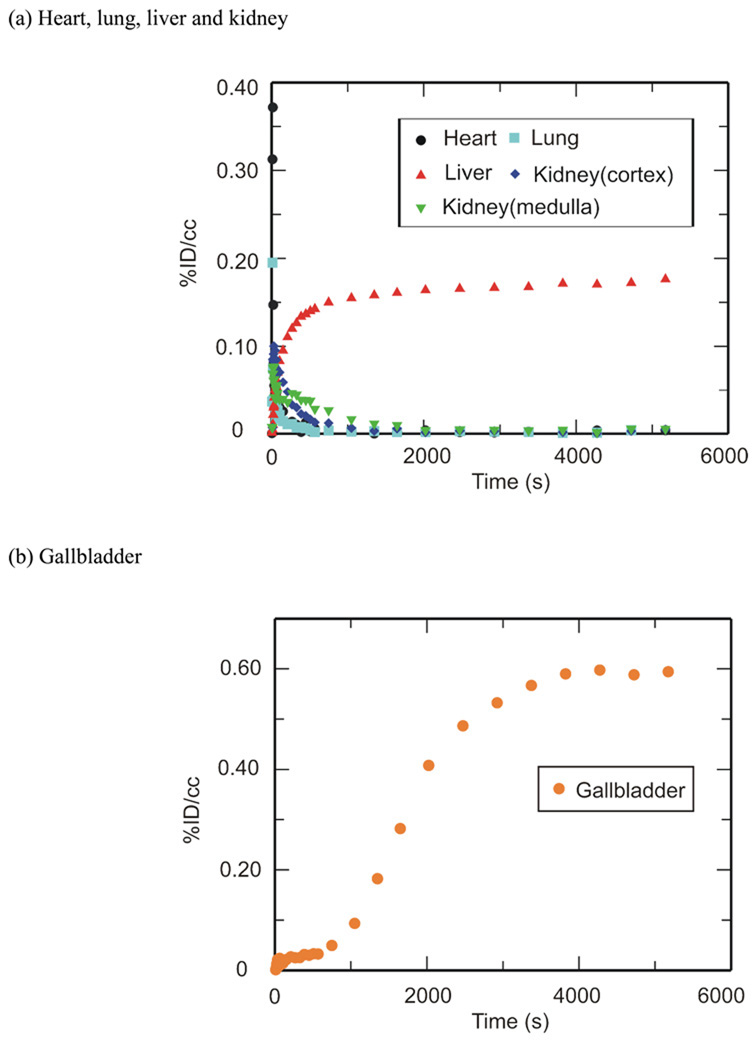
Figure 2. TACs for [11C]RIF in the (a) heart, lungs, liver, kidneys and (b) gallbladder.
Peripheral organ distribution following torso PET imaging of [11C]RIF administered i.v. to anesthetized baboons. TACs were generated from the image acquired after i.v. administration of each drug in baboons by manually drawing the ROIs. (a) heart, lungs, liver and kidneys. (b) gallbladder.

