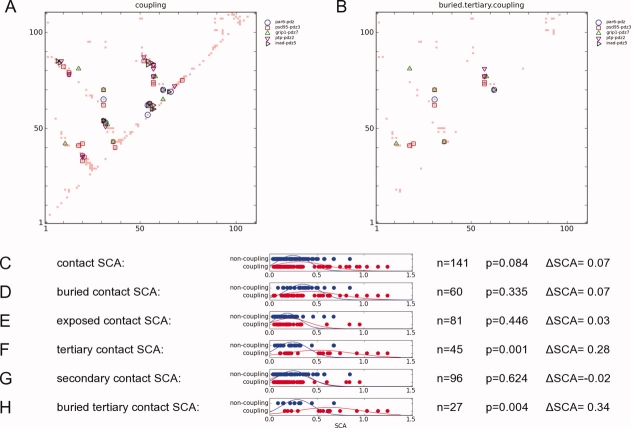
Figure 7.
Comparison between the SCA matrix and the RIP couplings.(A) The couplings identified in the 5 PDZ domains and mapped onto the contact map. Only residues that could be aligned across all 5 structures were used. (B) The couplings that were mapped onto the buried tertiary couplings of PSD95-PDZ3. Different domains possess different couplings. (C–H) t-test of couplings vs. noncouplings for different sets of contact SCA values. n refers to the number of samples, P refers to the P-values where P < 0.010 indicates that the two distributions are statistically different. ΔSCA is the difference between the average SCA free-energies between the distributions. [Color figure can be viewed in the online issue, which is available at www.interscience.wiley.com.]

