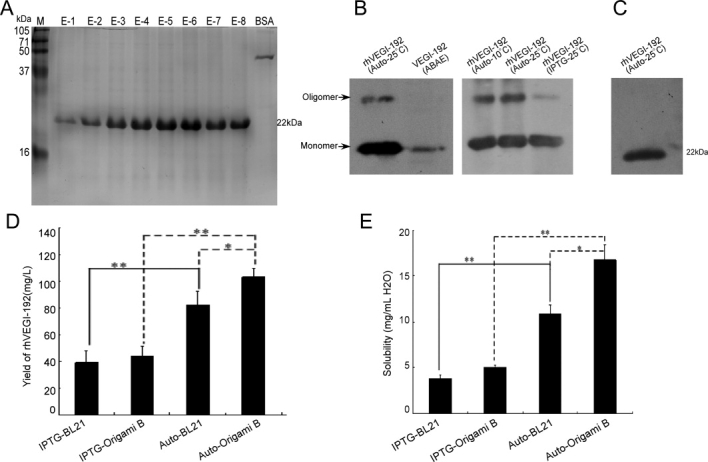
Figure 2.

SDS-PAGE and Western blotting analysis of the purified rhVEGI-192 protein. (A) Reducing SDS-PAGE analysis of purified fractions. Lanes E1–8, elution fractions from Ni-NTA column; Lane M, protein molecular weight marker; Lane BSA: 2 μg BSA loaded. (B, C) Western blotting analysis of the purified rhVEGI-192 by nonreducing (B) and reducing (C) SDS-PAGE (2 μg rhVEGI-192 protein was loaded). Endogenous VEGI of ABAE cell was included in panel B for comparison. (D, E) Yield (D) and solubility (E) of purified rhVEGI-192 protein. Results in (D) and (E) are presented as means ± SD. Statistical analysis (Student's two-tailed t test) revealed the differences in yields (D) and solubilities (E) among IPTG-induction and autoinduction at 25°C using BL21 (DE3) pLysS or Origami B (DE3) as host bacteria (*P < 0.05 and **P < 0.01).
