Figure 4.
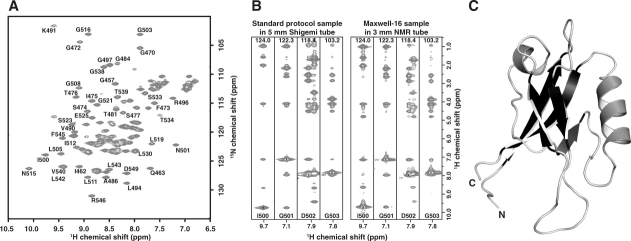
Validation of the optimized Maxwell-16 protocol. (a) An assigned 1H-15N-HSQC of hPar3-PDZ2 shows 113 of 114 expected resonances. Data collection was done at 25°C in 3 mm sample cells with 4 transients per FID using a 1 mM sample of hPar3 PDZ2 in 20 mM sodium phosphate pH 6.5 containing 50 mM sodium chloride, 0.02% sodium azide, and 10% (v/v) 2H2O. (b) Comparison of four 15N-edited 3D NOESY-HSQC strips from spectra collected on hPar3 PDZ2 (1 mM) prepared by a conventional large-scale production protocol (left) or the Maxwell-16 protocol (right). Data for the standard sample was acquired in a 5-mm Shigemi tube at 600 MHz, whereas data collection for the Maxwell-16 sample was acquired in a 3-mm NMR tube at 500 MHz with equal data collection times. Spectra of equivalent or higher quality were obtained from the Maxwell-16 sample despite a 2.5-fold reduction in the active NMR sample by mass and volume. Similar results were observed for the 3D triple-resonance experiments. (c) Ribbon diagram of the hPar3 PDZ2 NMR structure solved protein generated by five channels of the Maxwell-16. Structural statistics for the NMR ensemble are presented in Table III.

