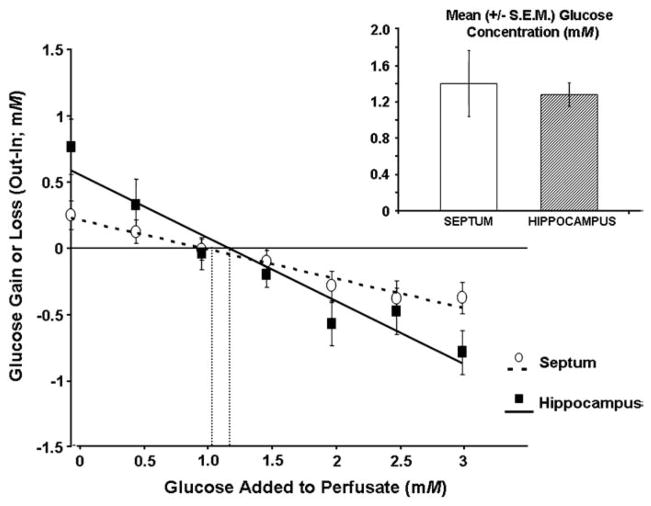
Fig. 3.
Glucose gain or loss to the brain as a function of perfusate concentration (0–3 mM) when the septum and hippocampus are sampled separately rather than simultaneously. The point of zero net flux is the estimated extracellular fluid concentration of glucose. The solid (hippocampus) and dashed (septum) lines are the line of best fit to the data for the point of zero net flux determination. The insert shows the mean (±S.E.M.) estimated glucose concentrations based on the individual regression analyses of each rat. The estimated extracellular fluid glucose concentration in the septum (1.39±.36 mM) and hippocampus (1.27±.13 mM) did not significantly differ (P>.05).

