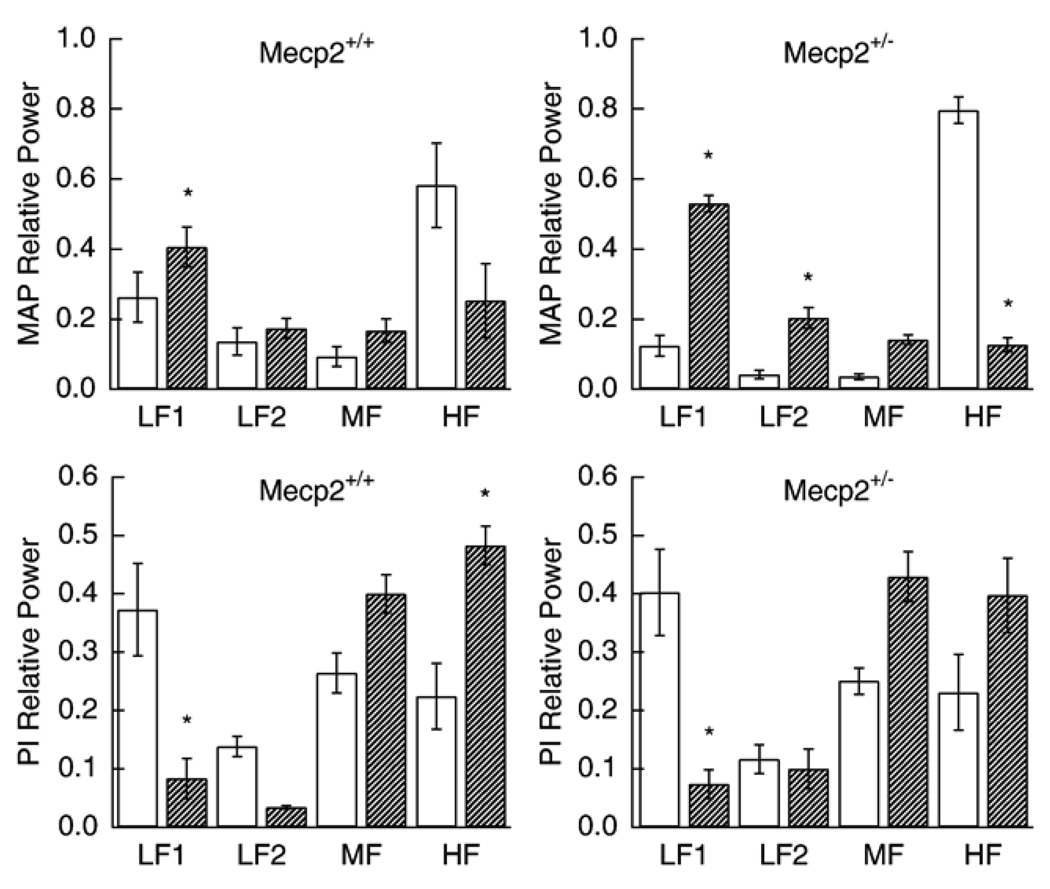
Fig. 1.
Effect of atropine on relative MAP spectral power (upper panels) for Mecp2+/+ and Mecp2+/− and relative PI spectral power (lower panels). Open bars are baseline and hatched bars are after administration of atropine. * significantly different from corresponding control (p values between <0.0001and 0.021).

