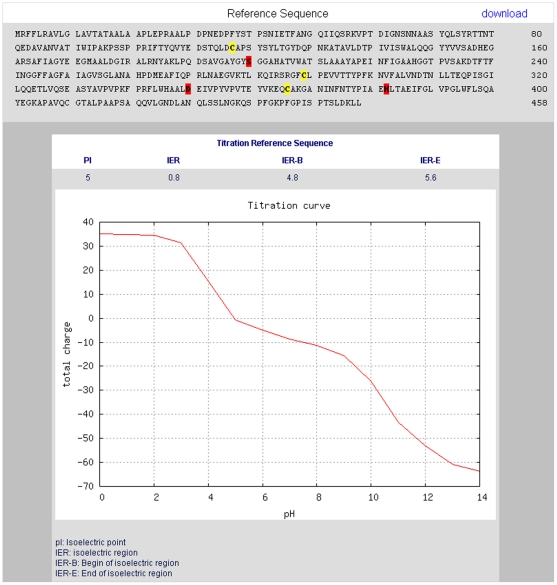
Figure 3. Web interface of the LED with the electrostatic properties feature.
Protein total charge is displayed for each pH value from 0–14 in graphical form. Graphical representations of titration curves are generated by GNUPLOT. The isoelectric point and the size of the isoelectric region are given in tabular form.

