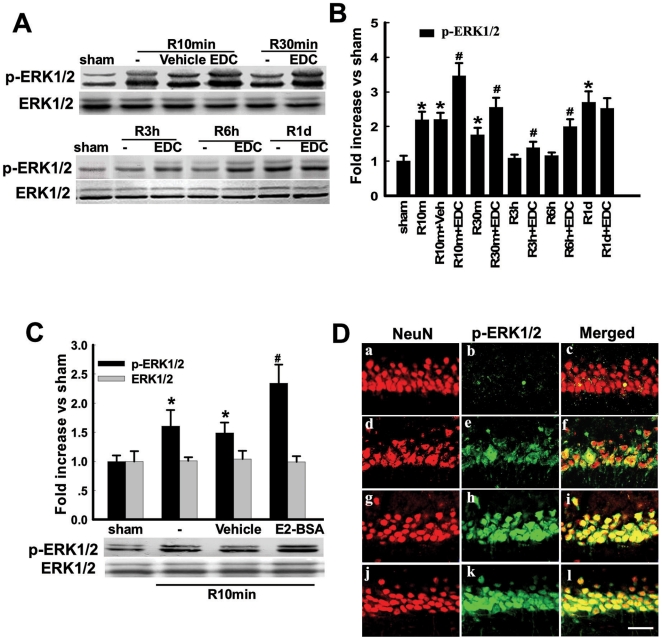
Figure 3. Effects of EDC and E2-BSA on phosphorylation level and protein expression of ERK1/2 following cerebral ischemia in the hippocampal CA1 region.
The time-course of p-ERK1/2 and the effect of EDC were shown in Fig. 3A. Rats were subjected to 10min ischemia followed by 10min, 30min, 3h, 6h and 1d reperfusion. (B) Bands corresponding to p-ERK1/2 were scanned and the intensities represented as values. F(11,36) = 41, * p<0.001 vs. sham; F(11,36) = 41, # p<0.05 vs. Vehicle. (C) Effect of E2-BSA on p-ERK1/2 at 10min of reperfusion. F(3,12) = 22, * p<0.05 vs. sham; F(3,12) = 22, # p<0.001 vs. Vehicle. (D) Confocal analysis of NeuN and p-ERK1/2 immunostaining in hippocampus CA1 at 10min reperfusion after global cerebral ischemia. Sham(a,b,c); vehicle(d,e,f); R10min+EDC(g,h,i); R10min+E2-BSA(j,k,l). Magnification 40×; Scale bar 50µm.

