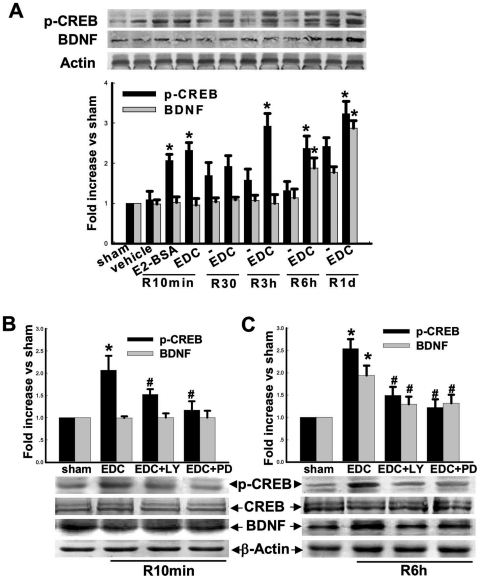
Figure 7. Effects of EDC on protein levels of CREB, p-CREB and BDNF following ischemic reperfusion in the hippocampal CA1 region.
(A) Western blot analysis showed the time-courses of p-CREB, CREB and BDNF protein expression, as well as the effects of EDC or E2-BSA. F(3,16) = 31, * p<0.001 vs. vehicle at the same timepoint. (B–C) Effects of PD or LY on CREB/p-CREB level and BDNF levels at 10min of reperfusion or 6h reperfusion in rats pre-treated with EDC. B: F(3,16) = 23, * p<0.001 vs. sham; F(3,16) = 23, # p<0.001 vs. EDC group. C: F(3,12) = 64, * p<0.001 vs. sham; F(3,15) = 21, # p<0.001 vs. EDC group. R: reperfusion, PD: PD98059, LY: LY294002.

