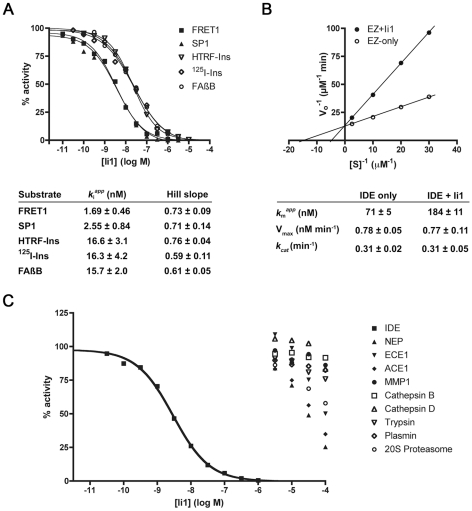
Figure 3. In vitro enzymatic analysis of IDE inhibition by Ii1.
A, Representative dose-response curves for a variety of IDE substrates and K i values and Hill slopes computed from 4 to 6 replications per substrate. Note that [S]/K M was kept constant for dose-response studies, permitting visual comparison of relative K i values. B, Lineweaver-Burk plot of IDE-mediated insulin degradation in the absence or presence of Ii1 (30 nM) and kinetic parameters calculated from 4 independent experiments. These data were obtained using recombinant human insulin and 125I-insulin at a fixed ratio (1000∶1), as described [48]. Note that the mode of inhibition is purely competitive, and was also observed using Aβ (Fig. S3). C, Dose-response curves showing the selectivity of Ii1 for IDE as compared to several other zinc-metalloproteases—neprilysin (NEP), endothelin-converting enzyme-1 (ECE1), angiotensin-converting enzyme-1 (ACE1) and matrix-metalloprotease-1 (MMP1)—and representative members of other protease classes, including cysteine (cathepsin B), aspartate (cathepsin D), serine (trypsin and plasmin) and threonine (20S proteasome). Data are mean of 2 to 3 experiments per condition.

