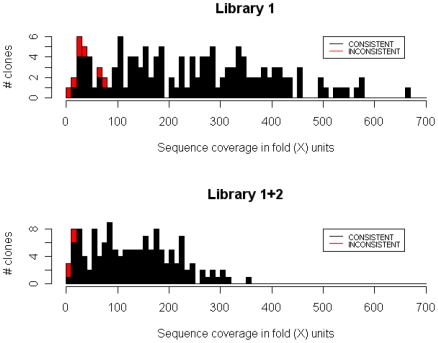
Figure 4. A histogram showing relationship between the sequence coverage for each clone and their assembly result classifications.
The histograms show the sequence coverage distribution of clones in Library 1 and 1+2. First, we aligned the shotgun reads against the finished reference clone sequences, allowing up to 3 mismatches. Next we calculated the sequence coverage (X-axis) for each clone as follows: (# of reads aligned with the clone)×(read length (36 bp))/(the length of the clone). Y-axis shows the number of clones. Every clone is colored according to its consistency of the CDS structure; a red bar shows the proportion of the inconsistent clones in that range. Clones that were not successfully amplified by PCR are not shown in the histogram, as they always had little sequence coverage by definition. Most of the clones classified as inconsistent had sequence coverage lower than 50×, suggesting that inconsistency might have arisen due to lower sequence coverage.

