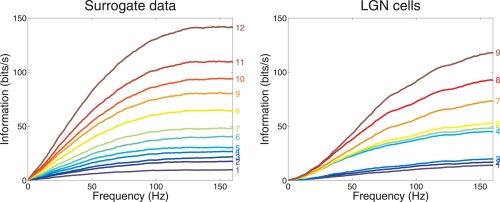
Figure 3.
Group information vs frequency for our Poisson model surrogate neurons and 9 LGN cells. The group size is indicated to the right of the cumulative curve for each group. The neurons were ranked according to their firing rate. The first group contained only the slowest firing neuron, and each new group was formed by adding the next ranking cell.

