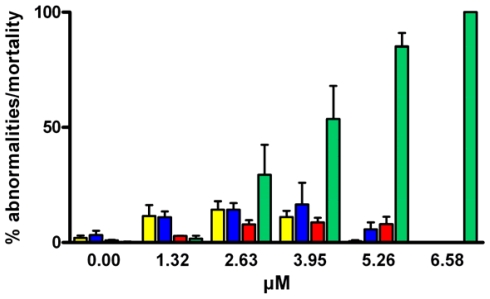
Figure 6.
Percentage of abnormal sea urchin larvae following 48 hours treatment with decadienal ranging from 1.32–6.58 μM. Control is reported as 0 μM decadienal concentration. Yellow bars = retarded larvae; blue bars = abnormal pluteus larvae; red bar = abnormal gastrulae and blastulae; green = dead pre-hatched embryos. Values (means ± S.D.; N = 600) are the results of three different experiments.

