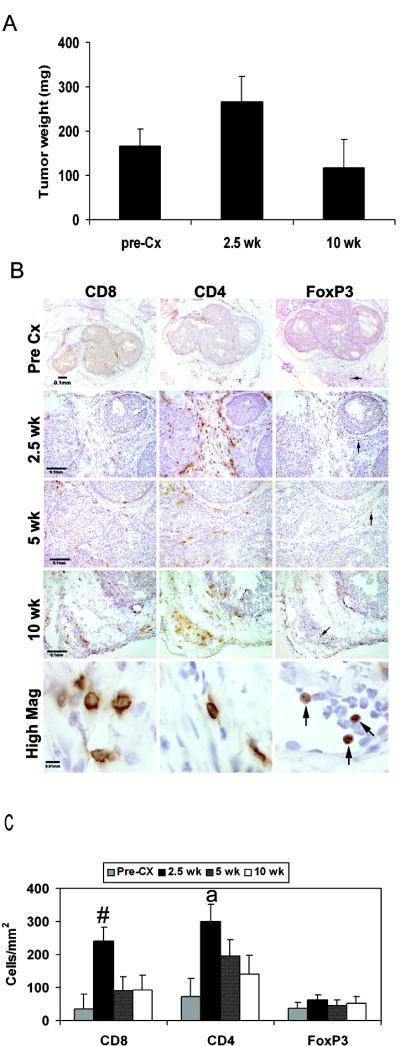
FIGURE 1. Castration induces a transient increase in T cell localization to the prostate without altering prostate tumor weight.
(A) Prostate wet weights at indicated time points are shown. (B) CD8, CD4 and FoxP3 staining at pre-castration (pre-Cx), 2.5, 5 and 10 weeks after castration. Scale bar indicates 100 μm (pre-Cx-10 weeks) and 10 μm (high mag). Arrows mark FoxP3+ cells. (C) CD8+ and CD4+ T cell numbers increased at 2.5 weeks post-castration. Quantification was performed as described in Materials and Methods.  , Pre-Cx; ■, 2.5 weeks;
  5 weeks; □ 10 weeks; #;p< 0.05 versus pre-Cx, 5 weeks and 10 weeks a; p<0.05 versus pre-castration and 10 weeks.

