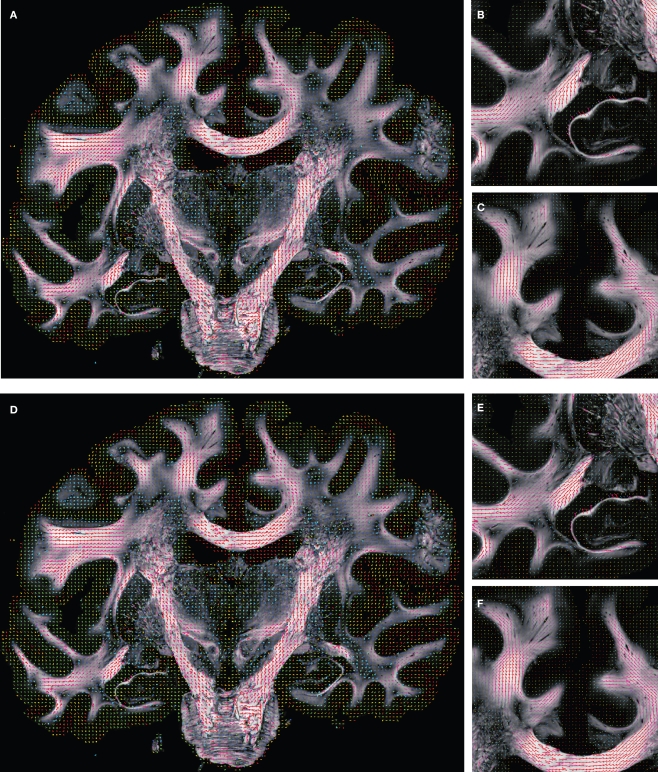
Figure 10.
Registered FOM overlaid by the corresponding retardation map. The vectors are shown before (A–C) and after reorientation by affine parameters (D–F). For visualisation the vectors of the FOM are subsampled. The zoomed images (B, C) and (E, F) show the same regions as marked in Figure 7 with the temporal (B, E) and mesial frontal cortex including the corpus callosum (C, F). The colour, length and thickness of the vectors encode the length of the 2D-projection of the 3D-fibre vector. Red colours correspond to vectors within the imaging plane, blue ones to vectors orthogonal to the imaging plane, while green and yellow ones represent transitional inclinations.

