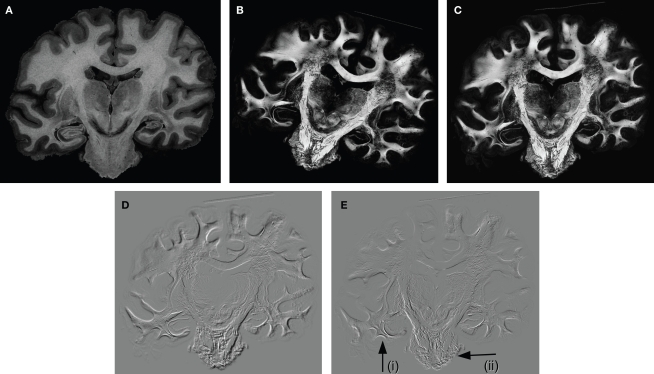
Figure 6.
Example of a greyscale blockface image (A) used as a reference for the registration of the retardation map (B). Affine and subsequent fluid registration yielded the registered retardation map (C). Difference images were calculated of the rigidly and the affine registered retardation maps (D), and of the affine and the fluid registered retardation maps (E); hereby, zero differences are shown in grey tones, negative values (rigid < affine, affine < fluid) are shown in black, and positive values are shown in white tones. That is, black and white values indicate differences between the transformation approaches. The comparison of (D) and (E) illustrates that the affine transformation is a global image transformation and, hence, all tissue parts were affected, whereas the fluid transformation showed local effects, e.g., in the temporal lobe [arrow (i)] and the pons [arrow (ii)].

