Figure 7.
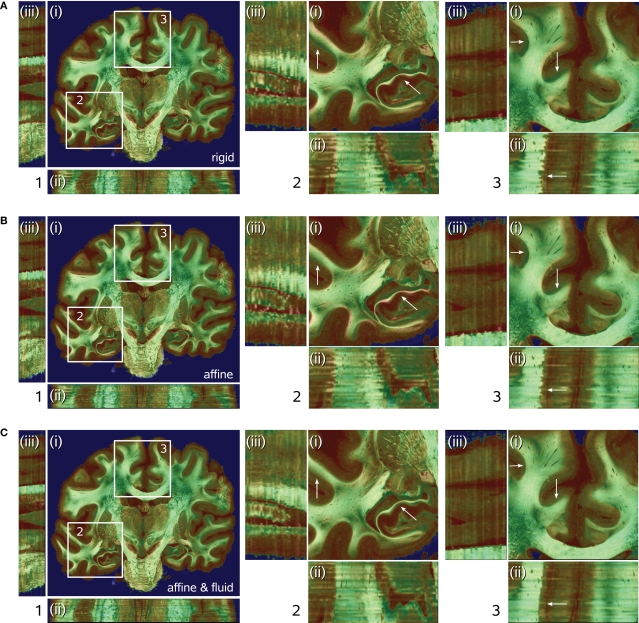
Results of transformations after rigid (A), affine (B), and affine followed by fluid registration (C). Each 3D data set is shown in coronal (i), horizontal (ii) and sagittal (iii) view. The pseudo-colour-coded blockface image volume is fused with the greyscale retardation map volume via α-blending. Grey matter shows mainly red tones in the blockface image and low grey values in the retardation map combining to a brown colour in the fused visualisation. White matter shows green tones and high grey values, respectively, combining to light green for high matching quality and dark green for low matching quality. Regions (2) and (3) within (i) correspond to the zoomed insets 2 and 3 of the total data set (1). Structures with significant improvement after fluid registration are indicated by arrows (white matter of cingulate gyrus, hippocampal region). The combination of affine and fluid registration yielded significant improvements of consistency.

