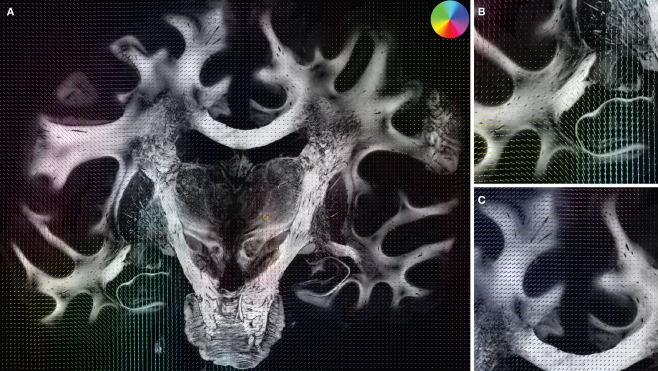
Figure 8.
Superimposition of the deformation vector field u resulting from the fluid registration and the corresponding retardation map |sin δ|. The vectors are pseudo-coloured (for direction see circular colour legend). Additionally to the entire section (A) the two regions specified in Figure 7 are shown in (B)–(C). Largest deformation occurred in the left hippocampal region.

