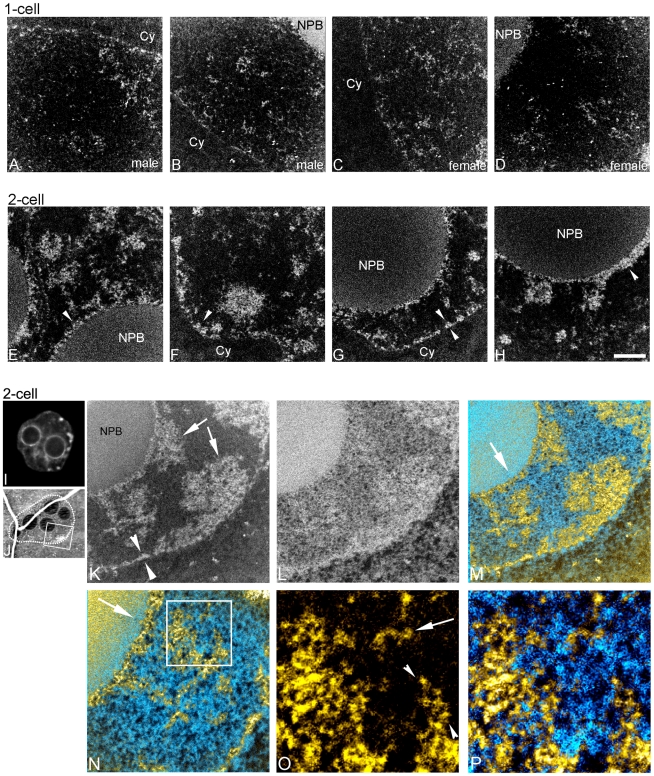
Figure 2. Chromatin becomes more compact and concentrated at nuclear envelope and periphery of nucleolar precursor bodies between one-and two-cell stage embryos.
Phosphorus maps (white on black background) of male (A,B) and female (C,D) pronuclei in one-cell embryo. Phosphorus maps of nuclei of two-cell embryos (E–H) (NPB, nucleolar precursor body; Cy, cytoplasm). Fluorescence image of a DAPI stained nucleus of a two-cell embryo (I). Low magnification mass image (J) of two-cell embryo showing the nucleus imaged in K–P. Phosphorus (K) and nitrogen (L) maps of a field of the two-cell embryo. Arrowheads (K) indicate chromatin organization along nuclear envelope, and arrows (K) indicate blocks of compact chromatin. Merge of phosphorus and nitrogen maps (M). N, higher magnification of field from M. Arrow shows relative orientation of the lower (M) and higher magnification view (N), and indicates chromatin accumulation on the periphery of a NPB. Phosphorus map (O) and merged phosphorus and nitrogen maps (P) of boxed region (N) are shown at higher magnification. Loop(s) of 10 nm chromatin fibre on the edge of a block of compact chromatin is indicated with arrowheads, and a chromatin fibre is indicated with arrow (O). Scale bar in H represents 500 nm (A–H), 7.5 µm (I), 400 nm (K–M), 250 nm (N) and 80 nm (O,P).

